エピソード

  • Oscar Robertson
    2026/08/06
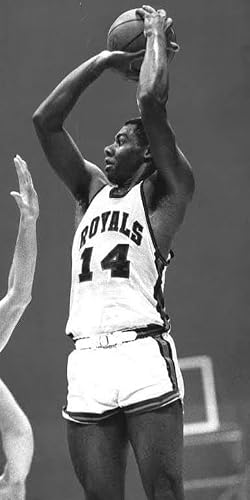
    161.5 career Net Wins. 28th all-time. One championship. One MVP. The Big O averaged 30.8 points, 12.5 rebounds, and 11.4 assists per game in 1961-62 the only player in NBA history to average a triple-double for an entire season until Russell Westbrook matched the feat 55 years later.Thanks for reading NET WINS! Subscribe for free to receive new posts and support my work.Oscar Robertson was the first selection of the 1960 NBA Draft, earned Rookie of the Year honors that season with the Cincinnati Royals, and averaged 30.5 points per game while leading the league in assists. He had just won a gold medal at the Rome Olympics and led the University of Cincinnati to back-to-back NCAA Final Fours. Measuring 6 feet 5 inches and weighing more than 200 pounds, Robertson was larger than most guards and used his size to gain position for scoring and rebounding. His jump shot was released far above his head with great efficiency, almost unblockable.The Career, Season by SeasonRegular season: 151.6 NW · Playoffs: 9.8 NW · Combined: 161.5 NW Average: 10.8 NW/season · Peak: 17.5 (1963-64)Thanks for reading NET WINS! This post is public so feel free to share it.The Triple-Double SeasonIn 1961-62, just his second year in the league, Robertson averaged 30.8 points, 12.5 rebounds, and 11.4 assists per game a triple-double average for an entire season. He remained the only player to do so for more than 50 years until Russell Westbrook matched his feat in 2016-17.The Net Wins formula captures exactly why this season was so remarkable. A triple-double average means positive production across every major category simultaneously: the points add directly, the 12.5 rebounds (a figure that would rank among the elite rebounders in the league in any era) add directly, and the 11.4 assists add directly. The formula sees Robertson’s 1961-62 as a 13.3 NW season genuinely elite, though not his career peak, because his efficiency that year (47.8% FG) left room for the fgmiss penalty to reduce his total.His peak by Net Wins was actually 1963-64: 17.5 NW, 31.4 PPG, 9.9 RPG, 11.0 APG the season he won his only MVP. It ranks among the top 20 single-season figures in the 47-season database.Five Seasons Near Triple-Double AveragesThe 1961-62 season gets all the attention, but Robertson averaged at least 9 rebounds and 9 assists per game in five separate seasons while scoring 30+ per game in six.* 1960-61: 30.5 / 10.1 / 9.7 — within reach of a triple-double average in his rookie season* 1961-62: 30.8 / 12.5 / 11.4 — the historical season* 1962-63: 28.3 / 10.4 / 9.5 — near-triple-double again* 1963-64: 31.4 / 9.9 / 11.0 — MVP year, his highest Net Wins* 1964-65: 30.4 / 9.0 / 11.5 — his highest assist averageHis offensive prowess changed the point guard stereotype from simply a passer and floor general to a scorer and offensive weapon. Before Robertson, point guards passed. After him, point guards did everything.The Cincinnati Years: 116.5 NW, Zero ChampionshipsRobertson spent ten seasons with the Cincinnati Royals and produced 116.5 Net Wins an average of 11.7 per season that would rank as an elite career for most players. He won zero championships.The obstacle, consistently, was Bill Russell’s Boston Celtics. For five seasons the Royals stumbled against Bill Russell’s Celtics in the playoffs. The Celtics won eight consecutive championships from 1959 to 1966. Robertson was at the peak of his powers during most of that run and had no path through Boston.Prior to the 1970-71 season, the Royals stunned the basketball world by trading Robertson to the Bucks for Flynn Robinson and Charlie Paulk. Many observers believed it was coach Bob Cousy’s jealousy of Robertson that led to the trade. Robertson had just broken many of Cousy’s passing records. The relationship had soured irreparably.The trade was among the most lopsided in NBA history in Milwaukee’s favor.Milwaukee and the ChampionshipTraded to the Milwaukee Bucks in 1970, Robertson joined forces with dominant center Lew Alcindor (later Kareem Abdul-Jabbar). The combination was explosive. The Bucks racked up 66 wins.Robertson’s 1970-71 season: 11.9 NW, 19.4 PPG, 5.7 RPG, 8.2 APG at age 32. Not his statistical peak, but a genuine elite performance on the best team in basketball. The Bucks became just the second team to sweep the Finals, ending in a 118-106 victory in Game 4 in Baltimore.After ten seasons of producing at an elite level for a franchise that couldn’t build around him, Robertson finally had his championship. He was 32. It had taken his entire prime.The Off-Court Legacy: Free Agency Exists Because of Oscar RobertsonThe playing career is extraordinary. The off-court legacy may be more significant.Robertson served as president of the NBA Players Association from 1965 to 1974, making him the first African American man to head a nationwide labor union in professional sports.In 1970, as NBPA president, he filed a class-action antitrust lawsuit against the NBA ...
    続きを読む 一部表示
    8 分
  • What NBA Skills Age the Worst — and What Lasts Forever
    2026/08/03

    Every NBA offseason comes with the same tired assumptions. A 34-year-old scorer is a ticking time bomb. A 36-year-old point guard is over the hill. Front offices treat the downswing like a cliff, operating on the assumption that skills universally erode the second a player hits their late twenties.

    It sounds intuitive, but is it actually true? And does father time treat every basketball skill the exact same way?

    Thanks for reading NET WINS! Subscribe for free to receive new posts and support my work.

    To find out, we mapped aging curves for nine distinct basketball skills using 46 years of NBA data, filtering down to players with at least 40 games and 20 minutes a night. The results show a clear split between what fades fast, what holds steady, and what actually gets better with age.

    Data: NBA regular season statistics 1980-2026. Sample: 9,162 qualifying player-seasons (minimum 40 games, 20 minutes per game). Decay rates calculated via linear regression on league average per-game production by age, ages 27-39. Survivorship bias affects ages 36+: fewer players qualify at older ages, and those who do are disproportionately elite. All statistics from the Net Wins database.

    © 2026 Will Fiore. Net Wins formula and all written content are original works. All rights reserved.


    This is a public episode. If you would like to discuss this with other subscribers or get access to bonus episodes, visit netwins.substack.com
    続きを読む 一部表示
    7 分
  • Kevin Durant
    2026/08/02

    198.3 career Net Wins. 14th all-time. Two championships. One MVP. The most efficient high-volume scorer in the history of this database, A 7-foot player with a guard’s skill set and a relentlessness that produced elite production across four organizations over 19 seasons.

    Thanks for reading NET WINS! Subscribe for free to receive new posts and support my work.

    Kevin Durant was selected second overall by the Seattle SuperSonics in the 2007 NBA Draft, and the franchise relocated to Oklahoma City the following season, becoming the Thunder. He was 19 years old, 6-foot-10, and immediately one of the most gifted offensive players the league had ever seen. He was the NBA’s youngest scoring champion in history at age 21, averaging 30.1 points per game in 2009-10.


    This is a public episode. If you would like to discuss this with other subscribers or get access to bonus episodes, visit netwins.substack.com
    続きを読む 一部表示
    7 分
  • Splitting Net Wins in Two
    2026/07/31

    This is an update to the Net Wins formula.

    Thanks for reading NET WINS! Subscribe for free to receive new posts and support my work.

    The formula hasn’t changed. The question has.

    Net Wins has always been built from one combined number — Player net actions = (PTS + REB + AST + BLK + STL) − (Missed FG + Missed FT + TOV + PF) — allocated to a player by his share of his team’s total, scaled to actual wins. That number has never distinguished between a bucket and a block. A 56-win season built entirely on scoring and a 56-win season built entirely on defense look identical once they land in the same column.

    Every term in that formula sorts cleanly into one side of the ball or the other. Points, assists, offensive rebounds, and the misses/turnovers that offense generates all belong on offense. Defensive rebounds, blocks, steals, and the fouls spent trying to get a stop all belong on defense:

    Offensive Net = PTS + AST + ORB − Missed FG − Missed FT − TOV Defensive Net = DRB + BLK + STL − PF

    Add them together and you get back exactly the same number the site has always used this isn’t a new stat, it’s the old one split down the middle. Which means Offensive Wins and Defensive Wins fall out for free:

    Thanks for reading NET WINS! This post is public so feel free to share it.

    Offensive Wins = Net Wins × (Offensive Net ÷ Total Net) Defensive Wins = Net Wins × (Defensive Net ÷ Total Net)

    As a sanity check, I ran it on the example already in the Net Wins Database: Cade Cunningham, 2025-26, 1,521 net actions, 9.31 Net Wins on a 60-win Detroit team. Split by side of the ball, that’s 7.79 Offensive Wins and 1.52 Defensive Wins a team icon who’s carrying Detroit’s offense far more than its defense, which tracks with how his season actually looked.

    Full 2025-26 database (Off Wins / Def Wins for every qualified player) is built. Next up: running the same split back across the full 1946–2026 archive so it’s live in the Explorer.

    © 2026 Will Fiore. Net Wins formula and all written content are original works. All rights reserved.


    This is a public episode. If you would like to discuss this with other subscribers or get access to bonus episodes, visit netwins.substack.com
    続きを読む 一部表示
    6 分
  • Moses Malone
    2026/07/28
    189.0 career Net Wins. Three MVP awards. The first modern player to go directly from high school to professional basketball. He outrebounded Kareem Abdul-Jabbar 73-30 in the 1983 NBA Finals and then went home to Petersburg, Virginia. The numbers trace a career that redefined what a center could be.Thanks for reading NET WINS! Subscribe for free to receive new posts and support my work.Moses Malone led Petersburg High School to 50 consecutive victories and two state championships and was one of the most sought-after college basketball prospects in history. He chose to bypass college, however, and sign with the Utah Stars of the American Basketball Association in 1974, thereby becoming the first player to enter professional basketball directly from high school (Historical technicality: Reggie Harding was drafted out of high school by the Detroit Pistons in 1962, though due to eligibility rules and a year spent playing in the Amateur Athletic Union (AAU), he did not actually play an NBA game until 1964).He was 19 years old. He had even signed a letter of intent to play at the University of Maryland before changing his mind and accepting a five-year, $1 million ABA contract. The decision was groundbreaking and controversial. It was also the correct decision.Moses Eugene Malone played from 1974 to 1995 two seasons in the ABA and 19 in the NBA, across eight franchises, dying in Norfolk, Virginia on September 13, 2015, at age 60. The career that began in the ABA at 19 ended in San Antonio at 39. The Career, Season by SeasonRegular season: 162.8 NW (Explorer) · Playoffs: 15.6 NW · Combined: 189.0 NW Average: 8.6 NW/season · Peak: 16.2 (1982-83)ABA seasons discounted at 90% in this newsletter’s adjusted all-time rankings. The Explorer’s combined figure reflects ABA stats at face value.Thanks for reading NET WINS! This post is public so feel free to share it.The ABA Years and What They Tell UsMalone’s two ABA seasons (1974-76) at ages 19-20 produced 10.5 combined raw NW respectable production for a teenager against professional competition, though this newsletter applies a 90% discount to pre-merger ABA statistics to account for competition level differences. At 90%, those seasons contribute 9.45 NW to the adjusted total rather than 10.5.After the ABA dissolved in 1976, he was acquired by the NBA’s Buffalo Braves, who traded him to the Houston Rockets two games into the 1976-77 season. His NBA debut season 9.3 NW at age 21, 13.5 PPG and 13.4 RPG he arrived in the NBA ready to compete at a high level.His 1977-78 dip to 4.8 NW at 22 is the one year the data shows an adjustment to new team. 15.0 rebounds per game but only 19.4 points the only dip in the data.The Houston Prime: 1978–1982Starting in 1978-79, Malone entered a five-year run that produced 62.4 NW averaging 12.5 per season across his ages 23-27. He won his first MVP in 1979 after averaging 24.8 points and a league-leading 17.6 rebounds per game. The 17.6 RPG figure is one of the highest single-season rebounding averages a reflection of both his relentless offensive board pursuit and his positioning in the paint.His 1,444 total rebounds in 1978-79, spread across 82 games, contributed an enormous positive to his Net Total before a single basket is counted. In 1981 he led the Rockets to the NBA Finals, their only Finals appearance in the pre-Olajuwon era. His 1980-81 playoff NW was 3.6, his best postseason run to that point. The Rockets lost in six games to Boston.His 1981-82 season may be his most statistically dominant: 31.1 PPG, 14.7 RPG, second MVP. The following season, 1982-83 produced even more Net Wins (16.2 vs 14.6), because of the Philadelphia context. A better team, better teammates, and a championship generated a larger win total for his contributions to share in.“Fo’, Fo’, Fo’” — The 1983 ChampionshipMoses Malone won his third NBA MVP Award after propelling Philadelphia to a 65-17 record in 1982-83. He famously predicted “Fo’ Fo’ Fo’,” declaring that the 76ers would sweep each round of the 1983 playoffs.The 76ers produced one of the greatest seasons ever with some of the league’s all-time best players including Julius Erving, Bobby Jones, and Maurice Cheeks. With the addition of Malone the 76ers became unstoppable, steamrolling thru the postseason 12-1 to win the 1983 NBA championship.The prediction was updated to “Fo’ Fi’ Fo’” they went 4-0, 4-1, 4-0 rather than three straight sweeps, losing one game to Milwaukee in the conference finals. Malone was named Finals MVP after averaging 26 points and 18 boards for the series, outrebounding Kareem Abdul-Jabbar 73-30 over the four games.Kareem was a Hall of Famer averaging 21 points per game in those Finals. Malone made him invisible on the glass.His 1982-83 playoff NW of 3.6 combined with his 16.2 regular season NW, made 1982-83 the most complete season in his career.The Long Sustain: 1983–1992What separates Malone from most centers of his era is the ...
    続きを読む 一部表示
    10 分
  • The NFL's Most Misunderstood Debate
    2026/07/27
    32 teams. One season of data. The results are clear but the conventional wisdom about what they mean is almost entirely backwards. Teams that run more do win more. The reason why changes everything.Thanks for reading NET WINS! Subscribe for free to receive new posts and support my work.Every NFL offseason produces the same conversation: run the ball to win, or throw to win? Coaches talk about “establishing the run.” Analytics departments preach pass efficiency. Fans argue about whether their team’s 4.2 yards per carry is what’s really driving the offense.The 2025 NFL season data answers the question directly and then immediately complicates it.The Numbers That Start the ConversationLeague averages in 2025: 32.1 pass attempts per game, 26.8 rush attempts per game. Teams ran on 45.6% of their plays. Here is what those numbers correlate with when you line them up against wins:The run-heavy teams win more. The pass-heavy teams don’t. Yards per carry has almost no relationship with winning. And the single variable most closely tied to winning isn’t run or pass volume it’s how efficiently a team passes when it does throw.By the quartile breakdown:Five wins separating the most run-heavy teams from the least. That’s the difference between a playoff appearance and a top-five draft pick.Thanks for reading NET WINS! This post is public so feel free to share it.Why the Conventional Wisdom Is Wrong About What This MeansHere’s where the analysis has to be honest about causality.Teams that are winning run more because they’re already winning. When a team has a lead in the fourth quarter, it runs the ball to drain the clock. When a team is trailing by 14 in the fourth quarter, it abandons the run and throws constantly which is why losing teams accumulate high pass attempt totals and low rush attempt totals. The correlation between rushing and winning is real. The direction of causality is backwards from what coaches usually imply.The evidence: rushing efficiency (yards per carry) has almost no relationship with winning (r = +0.095). If running caused winning, efficient running should correlate with winning. It doesn’t. What correlates with winning is rushing volume and volume is dictated by game situation, not by a team’s philosophical commitment to the run.This matters because “establish the run” is a strategy that says volume causes winning. The data says volume reflects winning. They’re very different claims.The Actual Signal: NY/ANet Yards per Pass Attempt — passing yards minus sack yards, divided by total pass plays including sacks — correlates with wins at r = 0.688 and with points scored at r = 0.887.That last number is worth dwelling on. NY/A explains 77.5% of the variation in points scored across all 32 NFL teams. It is, by a wide margin, the strongest single variable in this dataset. Every point of NY/A translates to roughly 2.9 additional wins across a season:Wins = 2.851 × NY/A − 8.89The spread between the league’s best (New England, 7.7 NY/A) and worst (New York Jets, 4.3 NY/A) is 3.4 points a projected gap of 9.7 wins. New England won 14 games. The Jets won 3. The formula nearly explains the entire difference.Look at what happens at the extremes:NY/A ≥ 7.0 (elite passing efficiency):NY/A < 5.0 (poor passing efficiency):Every team with NY/A below 5.0 won three or five games. Every team with NY/A above 7.0 won ten or more. The Las Vegas Raiders ran the ball the least of any team with poor NY/A and still went 3-14. The Jets ran more than the Titans, Browns, and Raiders and still went 3-14. Running volume didn’t save any of them.The One Team That Proves the RuleThe New York Jets are the only team in the 2025 NFL season where yards per carry (4.6) exceeded net yards per pass attempt (4.3). Every other franchise generates more value from passing than rushing on a per-play basis universally, across all 32 teams, regardless of coaching philosophy or roster construction.The Jets went 3-14.This is not a coincidence. When passing is less efficient than running, a team’s offense has broken down at its most fundamental level. The Jets’ situation isn’t evidence that running is better than passing. It’s evidence of how catastrophically bad their passing game was, so dysfunctional that their mediocre running game was actually the more productive option.Is There an Optimal Mix?Once you control for NY/A statistically, run share adds almost nothing to win prediction (R² gain of 0.009, not significant). The mix doesn’t matter independently of efficiency.But here’s the wrinkle: among the four teams with NY/A ≥ 7.0, there’s a pattern. New England (50% run share, 14W) and Seattle (51% run share, 14W) run much more than the Rams (44%, 12W). The teams with elite passing efficiency who also run heavily win the most.This is almost certainly a game theory effect. A team that passes at a 7.7 NY/A rate but runs on only 35% of plays is giving the defense permission to commit ...
    続きを読む 一部表示
    12 分
  • Kobe Bryant
    2026/07/25
    The Mamba. 20 seasons, 201.4 combined Net Wins, 11th all-time. His peak came not in the 81-point game or the scoring title season, but in 2002-03, a year of 30 points and 13.8 Net Wins alongside Shaquille O’Neal, before everything fell apart. The numbers trace a career defined by brilliance, conflict, and a second act nobody gave him credit for building.Thanks for reading NET WINS! Subscribe for free to receive new posts and support my work.Kobe Bryant entered the NBA straight from Lower Merion High School in Pennsylvania as the 13th overall pick in the 1996 draft, selected by the Charlotte Hornets and immediately traded to the Los Angeles Lakers. He was 17 years old. He became the youngest player ever to start an NBA game at the time and the youngest to win an NBA championship at 20 years old when the Lakers won their first of three consecutive titles in 2000.Twenty seasons later, he left as one of the most decorated and debated players in the history of the sport. The Net Wins Explorer traces all of it.The Career, Season by SeasonRegular season: 172.2 NW · Playoffs: 29.3 NW · Combined: 201.4 NW Average: 8.6 NW/season · Peak: 13.8 (2002-03)2013-14: missed almost entirely due to Achilles tear (April 2013)The Four ActsAct One: The Shaq Years (1996–2004) — 72.6 NWKobe’s first eight seasons are inseparable from Shaquille O’Neal. They won three consecutive championships (2000, 2001, 2002) and then dissolved in the most public partnership breakdown the league had seen since the Wilt-Russell era. The Net Wins data captures the arc precisely.His 1999-2000 season (11.0 NW) marked the first year he was genuinely elite, age 21, an MVP-caliber year under Phil Jackson’s triangle offense. The following three seasons climbed to 13.8 NW in 2002-03, his career peak. That peak season 30 points, 6.9 rebounds, 5.9 assists, 2.2 steals is the most complete statistical profile of his career, producing more Net Wins on a better team than any of his later scoring title years.The 2003-04 season (9.8 NW) is where the Shaq era ends numerically before it ended formally. The team chemistry was already broken. O’Neal’s weight, effort, and contract demands were creating friction Kobe publicly criticized. The Lakers reached the Finals and lost to the Pistons in five games their worst postseason result of the dynasty years. That summer, Shaq was traded to Miami.Thanks for reading NET WINS! This post is public so feel free to share it.Act Two: The Wilderness (2004–2008) — 43.0 NWFour seasons alone. The most famous of them, 2005-06, the 35.4 PPG scoring title, including 81 points against the Toronto Raptors on January 22, 2006 produced 12.5 Net Wins on a Lakers team that won 45 games and lost in the first round.Here is where the formula diverges most sharply from popular perception. The 81-point game is the most celebrated individual performance in modern NBA history. The 35.4 PPG regular season scoring average, the 9th highest All-Time, is the number attached to Kobe’s cultural peak. But his highest-Net-Wins season was not the scoring title year. It was 2002-03, three years earlier, when he averaged 30 points on a better team in a more efficient system.The formula explains why: 35.4 PPG requires an enormous volume of field goal attempts. Missing those attempts, even at 45% efficiency, Kobe missed 1,647 field goals in 2005-06, generates a significant fgmiss penalty that caps the Net Total ceiling regardless of the point total. The 13.8 NW peak came at 30 PPG on more balanced production across all box score categories. Elite scoring volume and peak Net Wins aren’t the same thing.The 2006-07 season (10.8 NW, 31.6 PPG) included what many consider his most famous individual quote: demanding a trade in the summer of 2007 after the Lakers lost in the first round to Phoenix. The trade demand was withdrawn when Andrew Bynum’s development and Pau Gasol’s arrival changed the calculus.Act Three: The Second Championship Era (2007–2011) — 48.4 NWThe Gasol trade in February 2008 is one of the most controversial in NBA history. Memphis received Kwame Brown, Javaris Crittenton, Aaron McKie, Marc Gasol, and two picks for a 27-year-old All-Star. Critics called it collusion. The NBA investigated and found no evidence of impropriety. What it produced was a Laker team capable of competing for championships again.Kobe’s 2007-08 season (12.8 NW) earned him the league’s regular season MVP, his first and only. His 2008-09 season (13.7 NW) was his second-highest ever and came with the first of his two second-act championships. The formula’s reading of that championship run: 4.3 playoff NW, his highest single postseason, across 23 games that ended with a championship over the Orlando Magic.Two consecutive Finals appearances (2009, 2010), two championship rings. The 2009-10 championship against the Boston Celtics went seven games, with Kobe posting 10.8 regular season NW and 4.0 playoff NW. His 2010 Finals performance, 28.6...
    続きを読む 一部表示
    9 分
  • In Defense of Jaylen Brown
    2026/07/20

    Most advanced metrics rate Brown as average to poor. Net Wins ranks him 7th in the league at 9.6. Both can be simultaneously true, and understanding why tells you more about how to evaluate basketball players than any single number ever will.

    Thanks for reading NET WINS! Subscribe for free to receive new posts and support my work.

    Jaylen Brown is one of the most analytically contested players in basketball. His turnover rate is high. His usage relative to his efficiency is a recurring criticism. His on/off numbers in Boston are often negative the team’s performance margins shrink when he plays compared to when he sits. He ranks first in this newsletter’s Ball Hog Index (FGA + FTA − AST, with below-average eFG%). By most public advanced metrics, he grades out as an average to slightly below-average player.

    Net Wins ranks him 7th in the league at 9.6.

    Both of those things are true at once. Working through why reveals something important about what any metric is actually measuring and what question you need to ask before you pick which one to use.

    © 2026 Will Fiore. Net Wins formula and all written content are original works. All rights reserved.


    This is a public episode. If you would like to discuss this with other subscribers or get access to bonus episodes, visit netwins.substack.com
    続きを読む 一部表示
    12 分